The Forest Carbon Ledger (FCL) is an alternative to REDD+. It is a new method for quantifying the carbon value of a forest. From this valuation, annual payments are issued to the stewards of the forest in exchange for protecting and restoring it over the long-term.
The current system for carbon accounting of forests is a method known as Reducing Emissions from Deforestation and Forest Degradation (REDD+). It’s a well-intentioned system that is hampered by a few fundamental defects. As a consequence, REDD+ is struggling to unlock the full funding potential needed for large-scale forest conservation across the world—particularly in the tropics.
FCL avoids the biggest pitfalls of REDD+. Namely, it relies on objective data rather than projections and subjective counter-factuals. It’s harder to cheat and manipulate and it’s also generally more practical. It calls for performance-driven PES payments based on the total amount of CO2 stored in the forest, which is amortized in annual increments and paid ex-post.
This article uses the Capuchin Corridor in Ecuador as a case study for how FCL is calculated and applied. It also provides a side-by-side comparison with REDD+ calculations for the same project area.
For a quick summary of the carbon valuation of the Capuchin Corridor, check out Carbon Assessment of the Capuchin Corridor & Camarones River Basin, which draws from this biomass inventory that we conducted in partnership with reearchers from the Universidad Técnica de Manabí. For a deep dive into the basis and construction of the FCL, refer to the companion article Flipping REDD+ on Its Head: The Forest Carbon Ledger Is a New Valuation Method. Last but not least, Mongabay covers the FCL in its article: Carbon Counting Without the Guesswork: Q&A with FCL creator Jerry Toth.
Contents
- Four Fundamental Differences Between REDD+ and FCL
- A Case Study in the Capuchin Corridor
- How to Measure FCL
- A Note About Blockchain
- Land Cover Assessments
- Land Class Distinctions & Aerial Imaging Technology
- Estimating Carbon Density
- FCL Calculations
- Calculating FCL Year-Over-Year
- Calculating CO2 Uptake by Immature Forests
- The FCL Ledger in Action: 3-Year Example
- Performance-Based Results
- Permanence & Leakage
- REDD+ Estimate of the Capuchin Corridor
- Side-by-Side Comparison of FCL and REDD+ Estimates
- Piloting FCL in the Camarones Watershed
- Equitable Distribution of Carbon Revenue
- Next Steps
- Additional Reading
Four Fundamental Differences Between REDD+ and FCL
There are four fundamental differences between FCL and REDD+. A more comprehensive explanation can be found in Flipping REDD+ on Its Head. Below is summary of the key differences between these two carbon accounting methods.
| Measures reality rather than hypothetical scenarios | |||||||
REDD+
|
FCL
|
||||||
| Measures actual carbon rather than avoided deforestation | |||||||
REDD+
|
FCL
|
||||||
| Moving beyond additionality | |||||||
REDD+
|
FCL
|
||||||
| Payouts are strictly based on results | |||||||
REDD+
|
FCL
|
||||||
A Case Study in the Capuchin Corridor
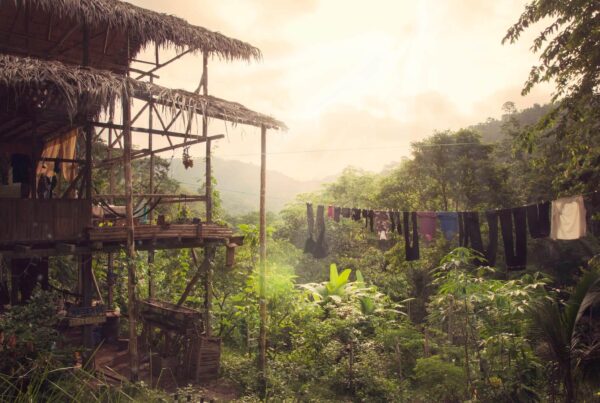
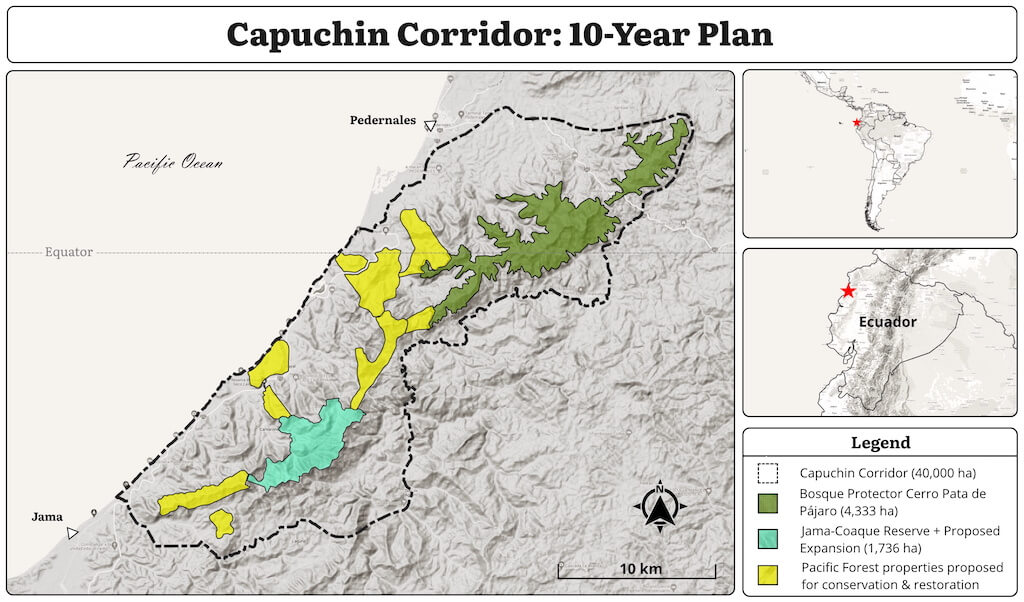
To demonstrate how FCL works, we’ll perform a case study in the Capuchin Corridor—a large-scale conservation project that TMA is spearheading in the Pacific Forest of Ecuador. The project is named in honor of the Ecuadorian Capuchin Monkey, which is endemic to the area and critically endangered.
The Capuchin Corridor spans a 43-kilometer mountain range that runs parallel to the Pacific Ocean. This corridor stores some of the last major remnants of Ecuador’s Pacific Forest—an ecosystem that has already lost 98% of its native forest over the course of the last century.
The Capuchin Corridor contains a wide range of distinct tropical forest types: cloud forest, moist evergreen forest, tropical dry forest, semi-deciduous forest, and a small remnant of primary-growth wet forest at the top of Cerro Pata de Pájaro. It also contains a patchwork of agricultural land that has been eating away at the forest for the last century.
Capuchin Corridor by the Numbers
- In its entirely, the Capuchin Corridor covers 40,000 hectares of land.
- This study is applied to 37,000 hectares, of which 24,600 hectares (representing 66% of total area) are still forested.
- The remainder of the land has already been converted to agriculture (31%) and residential areas (3%).
- The area is inhabited by 41 small rural communities totaling about 16,000 people.
Capuchin Corridor Project Activities
- Protect all remaining tracts of old-growth forest through purchase and/or easement.
- Restore degraded forest in areas no longer suitable for farming and grazing.
- Connect isolated forest fragments through regenerative agroforestry with local farmers.
- Carbon revenue will be distributed to local communities, in the form of performance-based PES payments, in exchange for protecting all the forest in their home watersheds.
- FCL will be used to quantify carbon and measure performance.
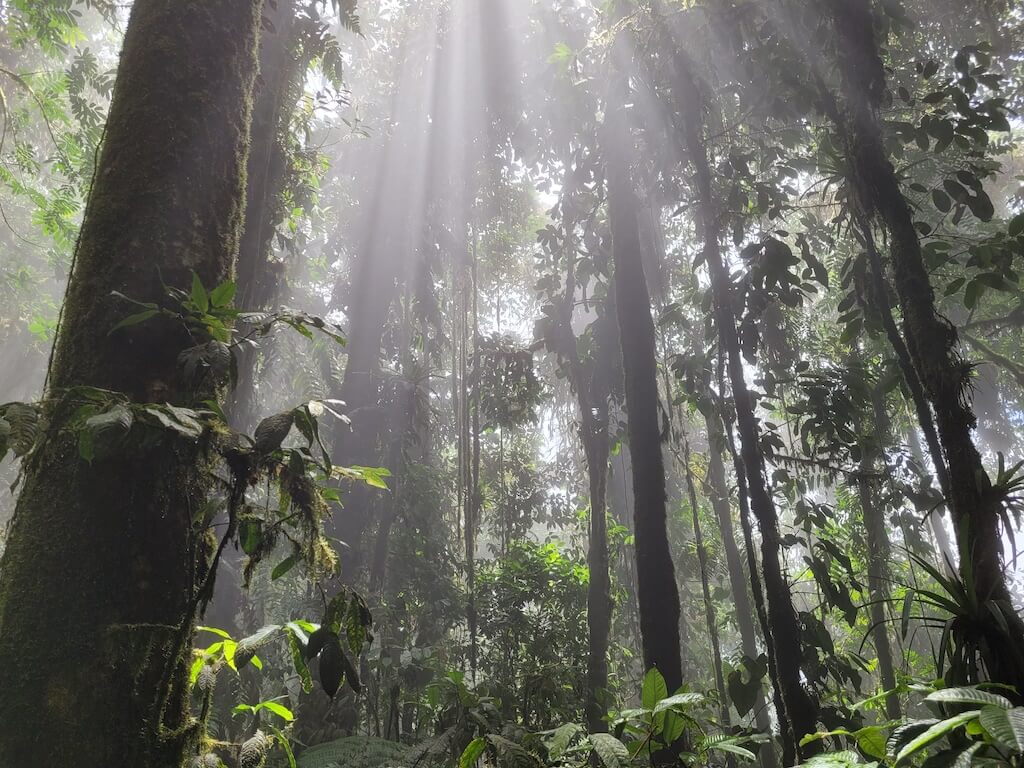
Primary-growth cloud forest at the peak of Cerro Pata de Pájaro, at the northern extreme of the Capuchin Corridor
How to Measure FCL
Before we get into the numbers, here’s a look at the FCL calculation process.
- At the beginning of Year 1, we start with an initial estimate of the total carbon stock of the forest. This estimate is matched to, and informed by, aerial imagery of the entire forest at that point in time.
- At the end of Year 1, we take a second round of aerial images of the same area. Machine learning algorithms then compare the new images with the original images and assess if there has been any deforestation or forest degradation during the year. If yes, the tally of ongoing CO2 storage is reduced accordingly in the ledger.
- Meanwhile, immature forests that are still actively growing will absorb additional CO2 each year, which is also added to the ledger. This only applies to immature forests—i.e., secondary-growth forest.
- Mature forests are considered to have reached carbon equilibrium and are not credited with additional carbon absorption, but their CO2 storage capacity—which is substantial—is included in the tally.
- All of this data is fed back into the ledger to recalculate the total CO2 storage at the end of the year, which is amortized over 50 years.
- If necessary, a risk buffer and/or leakage percentage is discounted.
- The resulting annualized value is then multiplied by the price per ton of CO2. Here, we use a price of $25 per metric ton (Mg) of CO2.
- Some of this payment is immediately paid to the forest stewards. The remaining balance can be held as an additional risk buffer and paid out after a certain pre-established period.
A Note About Blockchain
Smart contracts stored on a blockchain could be used to coordinate all FCL transactions. It could also be used to ensure transparency and prevent double counting. However, blockchain is an optional component. FCL can also be operated as a simple database.
This is a subject that merits additional discussion. For those readers who have experience in blockchain programing and who have an interest in forest conservation, please get in touch with us. We could use your help.
Land Cover Assessments
The first step is to determine how many distinct land classes can be distinguished by aerial imagery. In the Capuchin Corridor, we identified the following six land classes:
- Mature evergreen forest
- Secondary evergreen forest
- Mature wet forest
- Dry Forest & Semi-Deciduous Forest
- Agriculture
- Residential
Next, we contracted two different remote sensing analysts to use aerial imagery paired with machine-learning algorithms to quantify the area of each land class. The first analyst, Sake Alkema, worked at IUCN-Netherlands at the time; now he’s a remote sensing specialist for the global nature tech company Satelligence.
The second remote sensing specialist was the Plan Vivo-accredited carbon project developer The Landscapes and Livelihoods Group (TLLG).
To assist in this process, we helped train the latter’s algorithm by recording ground data at 211 different points throughout the project area—in each case noting which land class occupied that particular point. The software was able to use this data to learn the visual signature for each of the land classes. With this knowledge, it was able to assess the land cover of every single hectare in the entire project area.
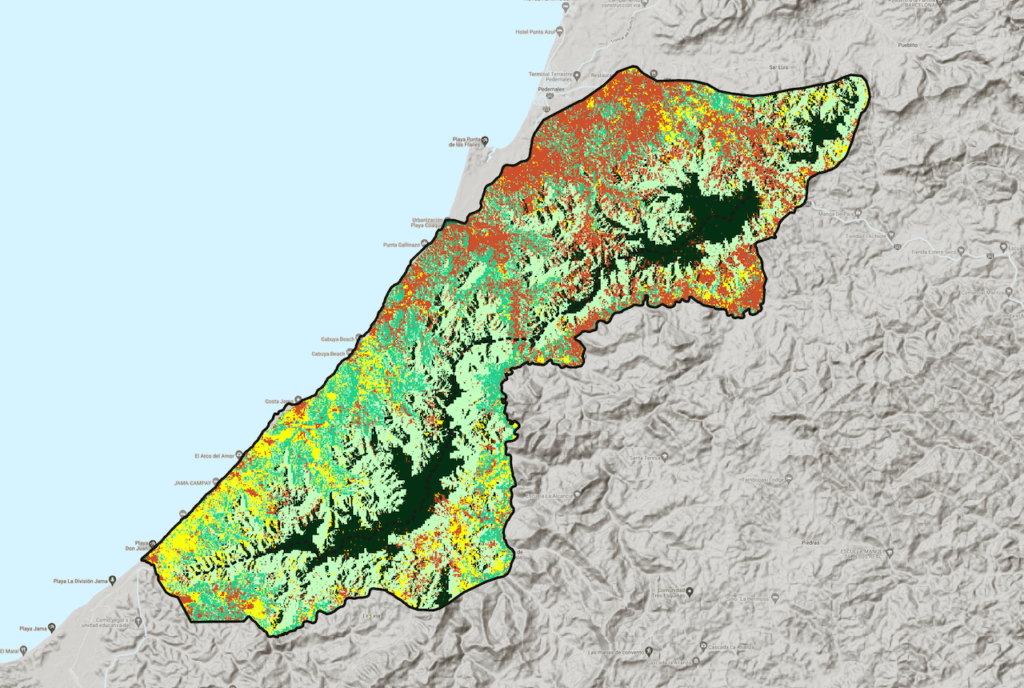
Land cover map of the Capuchin Corridor by The Landscapes & Livelihoods Group (TLLG)
Below are the assessments from each of the two remote sensing analysts.
Sake Alkema / IUCN-NL – 2018
| Land Class | Area (ha) | % of total land | % of total forest | Mg C/ha |
| Evergreen Forest | 15,622 | 42% | 63% | – |
| —Secondary Moist Forest | 10,935 | 30% | 44% | 66.3 |
| —Mature Moist Forest | 3,515 | 9% | 14% | 114.2 |
| —Cloud Forest | 1,172 | 3% | 5% | 101.6 |
| Dry Forest & Semi-Deciduous Forest | 8,989 | 24% | 37% | – |
| —Dry Forest | 989 | 3% | 4% | 73.6 |
| —Secondary Semi-Deciduous Forest | 7,192 | 19% | 29% | 64.7 |
| —Mature Semi-Deciduous Forest | 809 | 2% | 3% | 111.6 |
| Agriculture | 11,380 | 31% | N/A | 5.2 |
| Other (Residential/Water) | 1,032 | 3% | N/A | 2.6 |
| Total Land Area | 37,024 | 52.3 | ||
| Total Forest Area | 24,611 | 66% | 76.2 |
Notes:
- Evergreen Forest includes secondary moist forest, mature moist forest, and cloud forest.
- Dry Forest & Semi-Deciduous Forest includes tropical dry forest (i.e., deciduous forest), secondary semi-deciduous forest, and mature semi-deciduous forest.
- Measure carbon from above-ground biomass (AGB).
The Landscapes and Livelihoods Group (TLLG) – 2022
| Land Class | Area (ha) | % of total land | % of total forest | Mg C/ha |
| Mature Evergreen Forest | 6,172 | 17% | 29% | 116.8 |
| Secondary Evergreen Forest | 10,146 | 27% | 48% | 66.3 |
| Mature Wet Forest (Pata de Pájaro) | 380 | 1% | 2% | 148 |
| Dry Forest & Semi-Deciduous Forest | 4,516 | 12% | 21% | 70.3 |
| Agriculture | 14,037 | 38% | N/A | 5.2 |
| Other (Residential/Water) | 1,769 | 5% | N/A | 2.6 |
| Total Land Area | 37,020 | 49.8 | ||
| Total Forest Area | 21,214 | 57% | 83.3 |
Notes:
- Mature Evergreen Forest includes mature moist forest and cloud forest.
- More comprehensive definitions of different land classes can be found below.
- Measure carbon from above-ground biomass (AGB).
Land Class Distinctions & Aerial Imaging Technology
Why did we only choose six land classes? We certainly could have broken the area up into additional land classes. For example, even within the “mature evergreen forest” class, there are two sub-classes: moist evergreen forest and cloud forest.
But the remote sensing methods we used here—namely, conventional satellite imagery—did not have the capacity to distinguish between moist evergreen forest and cloud forest. On the other hand, LIDAR and/or multispectral imagery are capable of making this distinction. In some cases, they can also provide biomass estimates. They’re considerably more expensive to deploy.
As aerial imaging technology continues to improve and costs come down, LIDAR and multispectral analysis of forest cover will become increasingly accessible, which will improve accuracy of forest carbon stock monitoring at scale. We want to be at the forefront of this field and actively solicit technical support.
Estimating Carbon Density
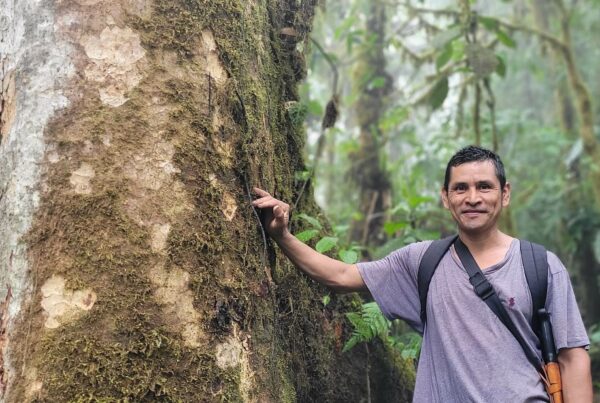
To estimate the initial carbon stock of the forest, we conducted several biomass inventories in the Capuchin Corridor, most notably in partnership with the Universidad Técnica de Manabí. Then we compared their results to each other and to other biomass inventories in nearby areas or comparable regions. The results were consistent across all biomass inventories. From these results, we took the averages for each forest class.
Below is a summary of the carbon densities of each major land class. To explore the results in greater detail, including biomass results for each sub-class, refer to Biomass Inventory of the Capuchin Corridor.
Average carbon density per hectare
| Major Land Cover Class | Total Carbon Stock | AGB Carbon |
| Mature Evergreen Forest | 190.8 | 116.8 |
| Secondary Evergreen Forest | 130.3 | 66.3 |
| Mature Wet Forest (Pata de Pájaro) | 241.6 | 148 |
| Dry Forest & Semi-Deciduous Forest | 135.1 | 70.3 |
| Degraded Dry/Semi-Deciduous Forest | 80.1 | 40.8 |
Notes:
- Measured in metric tons of carbon per hectare (Mg C/ha)
- Total carbon stock includes carbon from above-ground biomass, below-ground biomass, necromass, and soil organic carbon.
- “AGB” refers to carbon from above-ground biomass only.
FCL Calculations
With all of the above information, we can easily calculate the current FCL value of the Capuchin Corridor.
To convert carbon (C) to carbon dioxide (CO2), we multiply the weight of carbon by the ratio of the atomic weight of CO2 relative to C, which is 3.67.
This gives us the metric tonnage of CO2. To amortize this in an annual increment, we divide by 50 years. This does not mean that FCL forests are expected to only last 50 years.
In theory, an undisturbed stand of Pacific Forest in Ecuador would be expected to live for thousands of years, at least. It is important to point out that natural forest fires have never occurred in the Capuchin Corridor in recorded history.
Nevertheless, we amortize the carbon stock over a more realistic human management timeframe of two generations.
From this amount, we discount leakage. REDD+ projects generally offer a subjective estimate of leakage. Because FCL aims to eliminating subjectivity as much as possible, the best approach would be to perform an FCL assessment of the entire area surrounding the project area as well, to see if deforestation is simply being displaced to nearby areas. But that is beyond the scope of our initial test run. In this instance, we will have to satisfy ourselves with assuming a risk buffer and leakage discount of 15%.
Last but not least, we multiply the final CO2 number by the price per ton of carbon. This will fluctuate according to market forces. In this case, we assume a carbon price of $25/ton. In the table below, we only include carbon from above-ground biomass.
Note: the land cover numbers provided by TLLG are used for all FCL measurements.
FCL Estimate of the Capuchin Corridor (above-ground carbon, year 0)
| Land Class | Area (ha) | Mg C/ha) | Mg C) | Mg CO2) | Mg CO2 @ 1/50 |
| Mature Evergreen Forest | 6,172 | 116.8 | 720,797 | 2,645,325 | 52,907 |
| Secondary Evergreen Forest | 10,146 | 66.3 | 672,680 | 2,468,735 | 49,375 |
| Mature Wet Forest (Pata de Pájaro) | 380 | 148.0 | 56,240 | 206,401 | 4,128 |
| Dry Forest & Semi-Deciduous Forest | 4,516 | 70.3 | 317,552 | 1,165,417 | 23,308 |
| Total Forest Area | 21,214 | 83.3 | 1,767,269 | 6,485,878 | 129,718 |
| 15% risk buffer & leakage discount | 19,458 | ||||
| FCL annual CO2 storage (tons) | 110,260 | ||||
| FCL annual value @ $25/ton | $2,756,498 |
The table above only measures carbon stored in forested land. Can we also include carbon stored in agricultural land? We could. About 38% of the land in the Capuchin Corridor is agriculture, which is mostly comprised of cattle pasture, corn/maize fields, and fallow land in between slash-and-burn cycles. Although this land does contain some carbon in above-ground biomass, it doesn’t contain much—on average, about 5.2 tons of CO2 per hectare. This is only 4.5% of the above-ground carbon stored in one hectare of mature evergreen forest.
“Other” land cover, including residential and water, contains only 2% of AGB carbon relative to mature evergreen forest.
The table below measures the FCL value of all land in the Capuchin Corridor, including agricultural and residential land. Despite representing 43% of the total area of the Capuchin Corridor, non-forested land only contributes a mere 4.2% to the overall FCL carbon value of the Capuchin Corridor.
In the rest of the tables below, non-forested land will not be counted towards FCL or REDD+ estimations.
FCL Estimate of the Capuchin Corridor (AGB carbon, includes agricultural land, year 0)
| Land Class | Area (ha) | Mg C/ha | Mg C | Mg CO2 | Mg CO2 @ 1/50 |
| Mature Evergreen Forest | 6172 | 117 | 720,797 | 2,645,325 | 52,907 |
| Secondary Evergreen Forest | 10146 | 66 | 672,680 | 2,468,735 | 49,375 |
| Mature Wet Forest (Pata de Pájaro) | 380 | 148.0 | 56,240 | 206,401 | 4,128 |
| Dry Forest & Semi-Deciduous Forest | 4,516 | 70.3 | 317,552 | 1,165,417 | 23,308 |
| Agriculture | 14,037 | 5.2 | $72,291 | 265,306 | 5,306 |
| Other (Residential/Water) | 1,769 | 2.6 | 4,554.0 | 16,715 | 334 |
| Total Land Area | 37,020 | 49.8 | $1,844,114 | 6,767,899 | 135,358 |
| 15% risk buffer & leakage discount | 20,304 | ||||
| FCL annual CO2 storage (tons) | 115,054 | ||||
| FCL annual value @ $25/ton | $2,876,357 |
Both of the tables above show FCL values for the entire project areas and only measure above-ground carbon. Below, we use all carbon pools (above-ground biomass, below-ground biomass, necromass, and soil organic carbon) to calculate FCL of all forested land.
FCL Estimate of the Capuchin Corridor (total carbon stock, year 0)
| Land Class | Area (ha) | Mg C/ha) | Mg C) | Mg CO2) | Mg CO2 @ 1/50 |
| Mature Evergreen Forest | 6,172 | 190.8 | 1,177,792 | 4,322,495 | 86,450 |
| Secondary Evergreen Forest | 10,146 | 130.3 | 1,322,129 | 4,852,213 | 97,044 |
| Mature Wet Forest (Pata de Pájaro) | 380 | 241.6 | 91,808 | 336,935 | 6,739 |
| Dry Forest & Semi-Deciduous Forest | 4,516 | 135.1 | 610,203 | 2,239,443 | 44,789 |
| Total Forest Area | 21,214 | 150.9 | 3,201,931 | 11,751,087 | 235,022 |
| 15% risk buffer & leakage discount | 35,253 | ||||
| FCL annual CO2 storage (tons) | 199,768 | ||||
| FCL annual value @ $25/ton | $4,994,212 |
The FCL value from above-ground carbon is 55% of the FCL value when all carbon pools are taken into account.
 Calculating FCL Year-Over-Year
The real value of FCL is tracking forest carbon over time. Indeed, the name Forest Carbon Ledger refers to the ledger of forest carbon that is updated on an annual basis.
At the end of each year, we take another round of aerial images and analyze it for changes in forest cover relative to the previous year. Specifically, we determine how much forest was deforested, degraded, or maintained. Likewise, we refer to our biomass inventories to estimate the carbon cost of deforestation (forest that is converted to non-forest) and degradation (mature forest converted to secondary forest).
In the case of the Capuchin Corridor, we assume the following:
- If “mature evergreen forest” or “mature wet forest” is degraded, it becomes “secondary evergreen forest.”
- If “dry forest & semi-deciduous forest” is degraded, it becomes “degraded dry/semi-deciduous forest.”
- If “secondary evergreen forest” or “degraded dry/semi-deciduous forest” is further degraded, it is considered to be deforested.
- If any land is deforested, its carbon value is no longer counted on the FCL ledger.
Meanwhile, we assume that mature forest that remains intact still contains the same amount of carbon as it did the previous year. And we assume that secondary forest that remains intact has actually increased its carbon stock relative to the previous year.
Calculating CO2 Uptake by Immature Forests
To determine the annual average carbon uptake of secondary forests, we use this formula:
(Carbon density of mature forest – carbon density of secondary forest) / 30 years x 3.67
This assumes that, on average, it takes a secondary forest 30 years of growth to accumulate the same level of aboveground carbon as is contained by a mature forest. This is informed from Sierra (2012).
In the case of the Capuchin Corridor, the annual carbon uptake of secondary evergreen forests is:
(116.8 mg C/ha – 66.3 mg C/ha) / 30 = 1.68 mg C/ha per year.
To convert C to CO2, we multiply 1.68 x 3.67 = 6.18 Mg CO2/ha per year.
This means that, on average, each hectare of secondary evergreen forest removes 6.18 tons of CO2 from the atmosphere per year as it continues to grow. After 30 years, it will (on average) effectively reach its maximum carbon stock.
Likewise, the annual CO2 uptake of “Degraded Dry/Semi-Deciduous Forest” is:
(70.3 – 40.8)/30 x 3.67 = 3.61 Mg CO2/ha per year.
We don’t need to amortize annual CO2 uptake by dividing it by 50 because the annual uptake is already an annual number.
The FCL Ledger in Action: 3-Year Example
All of the above changes to the total carbon stock of the forest are fed back into the ledger at the end of each year. Here’s a hypothetical FCL ledger over a three-year period in the Capuchin Corridor.
Note: although the spreadsheet below takes up a lot of space, it’s not complicated. It’s just an annual tally of forest cover and CO2 storage, in the form of a spreadsheet. Putting it on the blockchain would add a layer of complexity, but it’s still a straightforward calculation that merely reports data gleaned from aerial imagery. That’s is one of the principle virtues of FCL.
|
Year-End
Area (ha) |
AGB
Mg C/ha |
Annual
degrad. (ha) |
Annual
deforest. (ha) |
Annual CO2
uptake (Mg) |
Ongoing CO2
storage (Mg) |
Total CO2
storage (Mg) |
|
| Year 0 | |||||||
| Degraded land | N/A | ||||||
| Deforested land | N/A | 0 | |||||
| Secondary evergreen forest | 10,146 | 66.3 | 2,468,735 | 2,468,735 | |||
| Mature evergreen forest | 6,172 | 116.8 | 2,645,325 | 2,645,325 | |||
| Mature wet forest (Pata de Pájaro) | 380 | 148.0 | 206,401 | 206,401 | |||
| Dry forest & semi-deciduous forest | 4,516 | 70.3 | 1,165,417 | 1,165,417 | |||
| Degraded dry & semi-deciduous forest | 0 | 40.8 | 0 | 0 | |||
| Year-End Total | 21,214 | 83.3 | 6,485,878 | 6,485,878 | |||
| Total CO2 Storage (Mg CO2) | 6,485,878 | ||||||
| Minus 15% risk buffer | 972,882 | ||||||
| Annual CO2 @ 1/50 (Mg CO2) | 110,260 | ||||||
| Annual CO2 value @ $25/ton | $2,756,498 | ||||||
| Year 1 | |||||||
| Degraded land since Year 0 | 20 | N/A | |||||
| Deforested land since Year 0 | 14 | N/A | |||||
| Secondary evergreen forest | 10,166 | 66.3 | N/A | 0 | 62826 | 2,473,601 | 2,536,427 |
| Mature evergreen forest | 6,172 | 116.8 | 0 | 0 | N/A | 2,645,325 | 2,645,325 |
| Mature wet forest (Pata de Pájaro) | 380 | 148.0 | 0 | 0 | N/A | 206,401 | 206,401 |
| Dry forest & semi-deciduous forest | 4,482 | 70.3 | 20 | 14 | N/A | 1,156,643 | 1,156,643 |
| Degraded dry & semi-deciduous forest | 20 | 40.8 | 0 | 0 | 72 | 2,994 | 3,066 |
| Year-End Total | 21,200 | 83.3 | 20 | 14 | 62826 | 6,484,964 | 6,547,862 |
| Total CO2 Storage (Mg CO2) | 6,547,862 | ||||||
| Minus 15% risk buffer | 982,179 | ||||||
| Annual CO2 @ 1/50 (Mg CO2) | 111,314 | ||||||
| Annual CO2 value @ $25/ton | $2,782,841 | ||||||
| Year 2 | |||||||
| Degraded land since Year 0 | 30 | N/A | |||||
| Deforested land since Year 0 | 19 | N/A | |||||
| Secondary evergreen forest | 10,171 | 66.3 | N/A | 0 | 62857 | 2,536,427 | 2,599,284 |
| Mature evergreen forest | 6,167 | 116.8 | 5 | 0 | N/A | 2,643,182 | 2,643,182 |
| Mature wet forest (Pata de Pájaro) | 380 | 148.0 | 0 | 3 | N/A | 206,401 | 206,401 |
| Dry forest & semi-deciduous forest | 4,477 | 70.3 | 5 | 0 | N/A | 1,155,353 | 1,155,353 |
| Degraded dry & semi-deciduous forest | 25 | 40.8 | 0 | 2 | 90 | 3,742 | 3,832 |
| Year-End Total | 21,195 | 83.3 | 10 | 5 | 62857 | 6,545,105 | 6,608,052 |
| Total CO2 Storage (Mg CO2) | 6,608,052 | ||||||
| Minus 15% risk buffer | 991,208 | ||||||
| Annual CO2 @ 1/50 (Mg CO2) | 112,337 | ||||||
| Annual CO2 value @ $25/ton | $2,808,422 | ||||||
| Year 3 | |||||||
| Degraded land since Year 0 | 50 | N/A | |||||
| Deforested land since Year 0 | 31 | N/A | |||||
| Secondary evergreen forest | 10,182 | 66.3 | N/A | 5 | 62925 | 2,599,284 | 2,662,209 |
| Mature evergreen forest | 6,160 | 116.8 | 4 | 3 | N/A | 2,640,182 | 2,640,182 |
| Mature wet forest (Pata de Pájaro) | 374 | 148.0 | 6 | 4 | N/A | 203,142 | 203,142 |
| Dry forest & semi-deciduous forest | 4,467 | 70.3 | 10 | 0 | N/A | 1,152,772 | 1,152,772 |
| Degraded dry & semi-deciduous forest | 35 | 40.8 | 0 | 0 | 126 | 5,239 | 5,365 |
| Year-End Total | 21,183 | 83.3 | 20 | 12 | 62925 | 6,600,618 | 6,663,670 |
| Total CO2 Storage (Mg CO2) | 6,663,670 | ||||||
| Minus 15% risk buffer | 999,551 | ||||||
| Annual CO2 @ 1/50 (Mg CO2) | 113,282 | ||||||
| Annual CO2 value @ $25/ton | $2,832,060 |
Performance-Based Results
If the carbon stock of the Capuchin Corridor doesn’t remain steady or increase over a given year, payments may be suspended. For a deep dive into how this mechanism would work, see the “FCL in the Event of Deforestation” section of Flipping REDD+ on Its Head: The Forest Carbon Ledger Is a New Valuation Method.
In the 3-year ledger example above, the general performance summary is the following:
| FCL Performance Summary | |
| Degradation rate since Year 0 | 0.24% |
| Deforestation rate since Year 0 | 0.15% |
| CO2 uptake from growth since Year 0 | 2.91% |
| Net CO2 gains since Year 0 | 2.74% |
Notice that there is no counterfactual analysis here. We’re not comparing this performance to what maybe could have happened in an alternate universe in which the project was not undertaken. We’re simply tabulating the entire carbon stock of the entire forest, every single year, and using that number to determine the CO2 value.
Permanence & Leakage
As with any REDD+ project, we also must conduct a non-permanence risk analysis of the Capuchin Corridor. This includes natural, internal, and external risks to the viability of the project and the longevity of the carbon stock of the forest.
In terms of natural risks, forest fires have never been recorded in the Capuchin Corridor. This bodes well for the permanence of carbon stocks in the region. We do live in a changing climate, which renders fire risk relatively less predictable than it would have been a few decades ago. Nevertheless, the fire risk in the Capuchin Corridor, relative even to some parts of the Brazilian Amazon, is quite low.
Verra assesses internal risk accordingly to the following factors: project management, financial viability, opportunity costs, and project longevity. External risks assessment includes issues of land tenure, community engagement, and political risk.
A comprehensive non-permanence risk assessment of the Capuchin Corridor project is still under construction. In the meantime, we’ll assume a 15% risk buffer & leakage discount.
For a more in-depth look at how FCL treats leakage, refer to the “Leakage” section in Flipping REDD+ on Its Head: The Forest Carbon Ledger Is a New Valuation Method.
REDD+ Estimate of the Capuchin Corridor
The same company that performed the second land cover assessment—The Landscapes & Livelihoods Group (TLLG)—also performed the REDD+ estimation for the Capuchin Corridor. TLLG is a carbon project developer and monitoring specialist accredited by Plan Vivo, a carbon offset standard with a strong emphasis on empowering rural communities.
TLLG used aerial imagery over the past seven years to measure deforestation and forest degradation rates in this area over that time span. From these numbers, they estimated future CO2 emissions during a business-as-usual scenario (i.e., no conservation project is implemented) versus a scenario in which the Capuchin Corridor conservation project is implemented.
The difference between these two numbers = the net carbon benefit of the project. In this case, we assumed 15% risk buffer and leakage discount, and a 75% effectiveness rate. The table below shows the net carbon benefit across all 37,000 hectares that TLLG measured within the Capuchin Corridor. We also show a comparison between values for total carbon stock versus carbon from above-ground biomass.
The table below assumes a risk buffer & leakage discount of 15% and an effectiveness rate of 75%.
| REDD+ Annual CO2 Benefit (by TLLG) | Total Carbon Stock | AGB Carbon |
| Baseline scenario emissions from deforestation and forest degradation expected during the project period | 295,227 | 220,369 |
| Expected project scenario emissions from deforestation and forest degradation expected during the project period | 73,807 | 55,092 |
| Non-permanence risk buffer & leakage emissions expected to result from displacement of deforestation and degradation during the project period | 33,213 | 24,792 |
| Climate benefits expected to result from reduced deforestation and forest degradation as result of project activities during the project period | 188,207 | 140,485 |
| Annual carbon value @ $25/ton | $4,705,179 | $3,512,131 |
The baseline numbers in the table above are informed by projections of annual deforestation and degradation rates in the future—in this case, over a five-year period of the future. These deforestation rates are extrapolated from historic deforestation rates in the same area as well as adjacent areas that are judged to be comparable in terms of topography, demographics, road access, economic pressures, political conditions, etc. It’s a subjective estimate.
| Baseline Projections | Forest Class |
Hectares per year
|
|
Hectares of deforestation avoided per year (projected)
|
Mature Evergreen | 104 |
| Secondary Evergreen | 202 | |
| Mature Wet Forest | 0 | |
| Dry & Semi-Deciduous Forest | 136 | |
| Total hectares | 442 | |
| Annual deforestation rate | 2.08% | |
|
Hectares of forest degradation avoided per year (projected)
|
Mature Evergreen | 47 |
| Secondary Evergreen | 0 | |
| Mature Wet Forest | 0 | |
| Dry & Semi-Deciduous Forest | 37 | |
| Total hectares | 84 | |
| Annual degradation rate | 0.40% |
Side-by-Side Comparison of FCL and REDD+ Estimates
The table below presents a side-by-side comparison of the two different carbon accounting methodologies (FCL vs REDD+) in the estimation of annual CO2 benefit of the Capuchin Corridor, both in terms of total carbon stock and AGB carbon. .
| Total Carbon Stock | AGB Carbon | |
| Forest Carbon Ledger (FCL) | ||
| Annual CO2 benefit (tons) | 199,768 | 110,260 |
| Annual CO2 value at $25/ton | $4,994,200 | $2,756,500 |
| REDD+ | ||
| Annual CO2 benefit (tons) | 188,207 | 140,485 |
| Annual CO2 value at $25/ton | $4,705,175 | $3,512,125 |
The annual CO2 benefits are nearly identical when measuring all carbon pools, with FCL computing a bit higher. When only above-ground carbon is measured, REDD+ is higher.
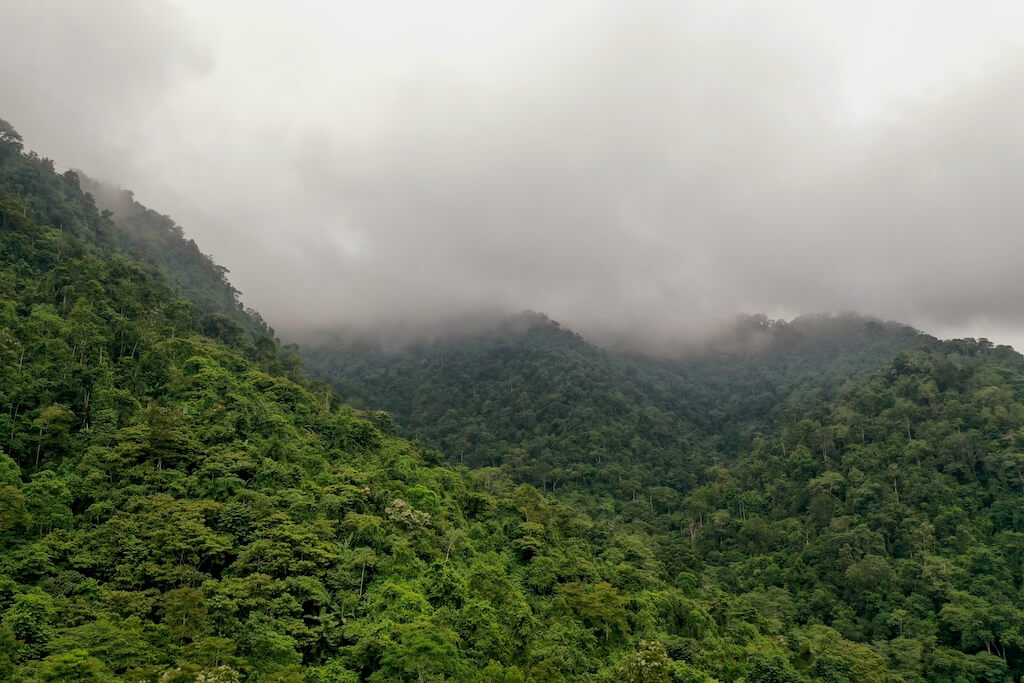
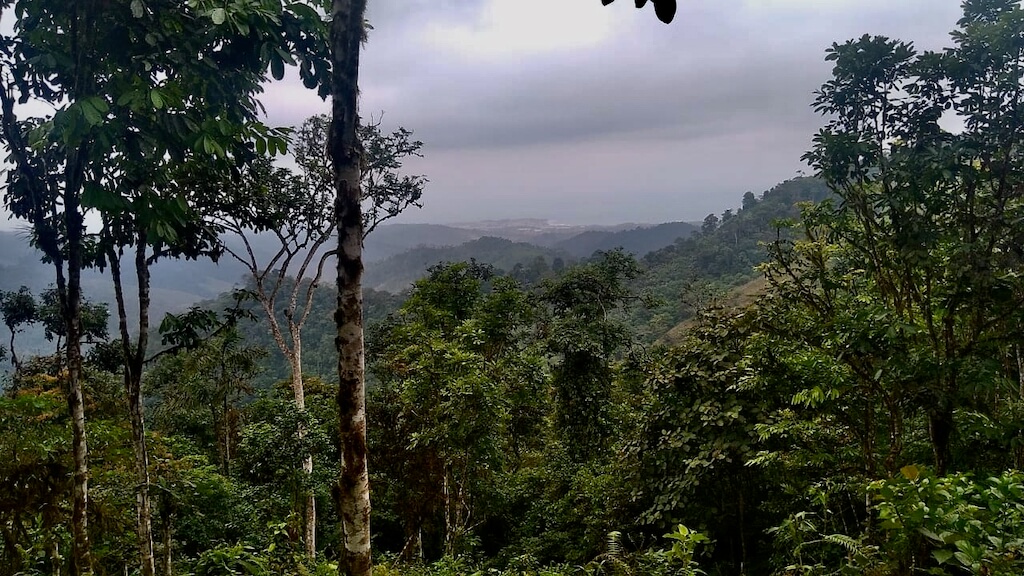
Cloud forest at the headwaters of Camarones River Basin (Jama-Coaque Reserve)
Piloting FCL in the Camarones Watershed
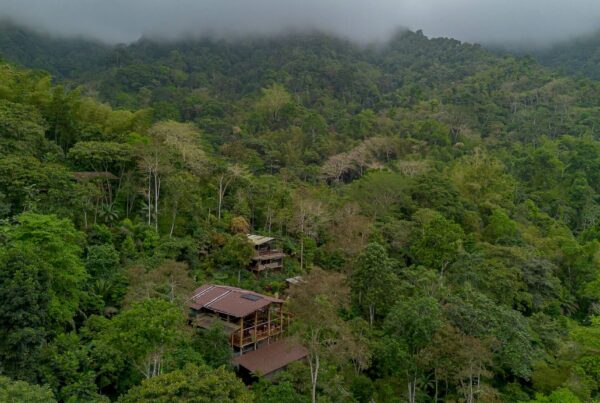
At the time of publishing this article, the Capuchin Corridor does not have carbon funding. Our plan is to pilot the FCL system in the Camarones River Basin, which occupies 2,980 hectares in the heart of the Capuchin Corridor. Then we would expand to to the Capuchin Corridor.
The Camarones River Basin is the site of the Jama-Coaque Reserve, which is where TMA pilots most its projects before expanding out into the rest of the Capuchin Corridor. The Camarones River Basin is inhabited by 91 families totaling about 400 people. The FCL estimations for above-ground carbon is below.
FCL Estimate of the Camarones River Basin (above-ground carbon, year 0)
| Land Class | Area (ha) | Mg C/ha) | Mg C) | Mg CO2) | Mg CO2 @ 1/50 |
| Mature Evergreen Forest | 878 | 116.8 | 102,572 | 376,440 | 7,529 |
| Secondary Evergreen Forest | 897 | 66.3 | 59,484 | 218,308 | 4,366 |
| Mature Wet Forest | 0 | 148.0 | 0 | 0 | 0 |
| Dry Forest & Semi-Deciduous Forest | 352 | 70.3 | 24,745 | 90,813 | 1,816 |
| Total Forest Area | 2,127 | 156.1 | 186,801 | 685,561 | 13,711 |
| 15% risk buffer & leakage discount | 2,057 | ||||
| FCL annual CO2 storage (tons) | 11,655 | ||||
| FCL annual value @ $25/ton | $291,363 |
Equitable Distribution of Carbon Revenue
For any forest-based carbon project—be it REDD+ or FCL—it’s important to ask how the carbon revenue is distributed. In the worst of cases, local communities are excluded from carbon revenue, or receive only a token share of it.
But forest conservation and restoration projects—particularly community-based projects like the Capuchin Corridor—only work if the people who live in the project area are fully engaged and take an active role in both the decisions and the work.
The Plan Vivo certification standard, which is arguably the most progressive in the field, requires that at least 60% of carbon revenue is distributed to the communities that live in the project area.
Our proposal, for both the Camarones Watershed and the Capuchin Corridor, is to allocate 20% of carbon revenue for direct costs associated with project implementation, monitoring, and verification. The remaining 80% will be distributed to all communities living in the project area.
A significant share of community funds—40%—will be distributed directly to each household in the project area. Families can use these funds to cover costs for higher education and/or vocational training, start-up capital for regenerative agriculture and other micro-enterprises, and specialized health care.
The majority of these funds—60%— will be allocated to a community trust, which is administered by a representative body of community members in service of executing a collectively agreed-upon development plan—also called a “Life Plan.”
The Life Plan is a concept developed by indigenous communities in the Amazon. It’s akin to a community “development plan” but goes beyond the basic economic and social programs associated with conventional 20th century development. It aims at overall community well-being.
Community Life Plans typically focus their investment on building and improving schools, health care, public works such as parks and play fields, off-grid energy sources such as solar panels and battery banks, communications infrastructure like satellite internet, start-up capital for small businesses, support for cultural activities, grants for arts, etc.
In other words, collective investments that improve human capital and enhance the quality of life in a meaningful way.
But the FCL funding opportunities above are tied to the carbon stock of the project area. Therein lies the powerful collective incentive to protect and restore important tracts of forests. Doing so is economically advantageous for the people who live in the area.
Next Steps
- Submit the FCL concept to the forest conservation and carbon offset community, listen to constructive feedback, and continue to refine it.
- Pursue high-quality LIDAR and multispectral imagery of the project area.
- Assess non-permanence risk.
- Continue to support local communities as they deliberate and design of their Life Plan development goals.
- Work with crypto/blockchain specialists to design an FCL registry on the blockchain and/or explore other ways to ensure transparency and prevent double counting of carbon benefits.
- Pursue funding for the FCL pilot project in the Camarones Watershed ($291,000 per year, using a carbon price of $25/ton of CO2 and only counting above-ground biomass).
- Use our experience implementing the pilot project to prepare for and refine a larger project applied to the entire Capuchin Corridor.
- Use our experience building the Capuchin Corridor to spark other FCL projects in other parts of Ecuador and throughout the tropics.
Additional Reading
- Flipping REDD+ on Its Head: The Forest Carbon Ledger (FCL) is a new valuation method
- Brief Summary of the Capuchin Corridor: A 40,000-hectare rainforest conservation & restoration project
- Full-Spectrum Forest Valuation: A holistic model for quantifying the monetary value of a forest
- How to Finance Global Ecological Prosperity: Creation of the International Biosphere Fund, modeled (somewhat) like the IMF
- The Most Endangered Rainforest You’ve Never Heard Of: An intimate portrait of the Pacific Forest of Ecuador