This article provides a summary of the biomass inventories and carbon density calculations of the Capuchin Corridor in coastal Ecuador. To see how these numbers have been used to estimate the carbon value of the Capuchin Corridor, refer to Carbon Assessment of the Capuchin Corridor & Camarones River Basin. For a deep dive into the different carbon accounting methodologies we’ve tested, check out Comparing the Forest Carbon Ledger (FCL) to REDD+: Using the Capuchin Corridor in Ecuador as a case study. And to learn more about the Forest Carbon Ledger, check out Flipping REDD+ on Its Head: The Forest Carbon Ledger (FCL) is a new valuation method.
Note: the Capuchin Corridor is located in the Pacific Forest of Ecuador, known for its remarkable diversity of forest types. This is one of the reasons why it is such an ecologically unique place. It also makes carbon estimation more difficult because each forest class needs to be assessed separately. In some cases, we went so far as to measure various sub-classes as well.
Background
To estimate the carbon value of the Capuchin Corridor, we conducted several biomass inventories in the Jama-Coaque Reserve (JCR) and other sites throughout the Capuchin Corridor. The primary study was conducted in partnership with the Universidad Técnica de Manabí, under the guidance of Dr. Carlos Salas-Macias and Dr.Ezequiel Zamora-Ledezma in 2022-2023. Xavier Haro-Carrión, from Macalester College, as well as Mike Ellis, from Tulane, also provided biomass inventories of the Capuchin Corridor.
We compared their findings to each other and to other biomass inventories in nearby areas or comparable regions. The results were consistent across all biomass inventories. From these results, we took the averages for each forest class. We include links to published studies and/or raw data is for each biomass inventory that is referenced below.
Carbon Density Summary
Below is a summary of the average carbon density per hectare of each major land class.
| Major Land Cover Class | Total Carbon Stock | AGB Carbon |
| Mature Evergreen Forest | 190.8 | 116.8 |
| Secondary Evergreen Forest | 130.3 | 66.3 |
| Mature Wet Forest (Pata de Pájaro) | 241.6 | 148 |
| Dry Forest & Semi-Deciduous Forest | 135.1 | 70.3 |
| Degraded Dry/Semi-Deciduous Forest | 80.1 | 40.8 |
Notes:
- Measured in metric tons of carbon per hectare (Mg C/ha)
- Total carbon stock includes carbon from above-ground biomass, below-ground biomass, necromass, and soil organic carbon.
- “AGB” refers to carbon from above-ground biomass only.
- See below for detailed definitions of forest types and land class distinctions.
Biomass Inventories
Below are the results of biomass inventories and estimations for each land cover class and subclass. Complete notes and definitions are provided below.
| Land Cover Class | AGB carbon | Study Location | |
| (Mg C/ha) | |||
| Cloud Forest | |||
| C. Salas-Macias, E. Zamora-Ledezma | 101.6 | Capuchin Corridor, coastal Ecuador | |
| Mature Moist Forest | |||
| C. Salas-Macias, E. Zamora-Ledezma | 121.8 | Capuchin Corridor, coastal Ecuador | |
|
Mature Evergreen Forest*
|
|||
|
X. Haro-Carrión et al. |
112.4 | Capuchin Corridor, coastal Ecuador | |
| M. Ellis | 118.6 | Capuchin Corridor, coastal Ecuador | |
| C. Salas-Macias, E. Zamora-Ledezma | 111.7 | Capuchin Corridor, coastal Ecuador | |
| Mature Evergreen Forest Unweighted Avg. | 114.2 | Capuchin Corridor, coastal Ecuador | |
| Mature Evergreen Forest Weighted Avg. | 116.8 | Capuchin Corridor, coastal Ecuador | |
| Secondary Evergreen Forest | |||
| X. Haro-Carrión et al. | 65.3 | Capuchin Corridor, coastal Ecuador | |
| M. Ellis | 67.3 | Capuchin Corridor, coastal Ecuador | |
| Secondary Evergreen Forest Avg. | 66.3 | ||
| Mature Coastal Wet Forest | |||
| Mature Coastal Wet Forest (Pata de Pájaro) | 148.0 | Mache-Chindul, coastal Ecuador | |
| Tropical Dry Forest | |||
| C. Salas-Macias, E. Zamora-Ledezma | 77.7 | Capuchin Corridor, coastal Ecuador | |
| C. Salas, J.C.A Orihuela | 69.6 | Pacoche Reserve, coastal Ecuador | |
| Tropical Dry Forest Avg. | 73.6 | ||
| Mature Semi-Deciduous Forest | |||
| C. Salas-Macias, E. Zamora-Ledezma | 111.6 | Capuchin Corridor, coastal Ecuador | |
| Secondary Semi-Deciduous Forest | |||
| X. Haro-Carrión / M. Ellis | 64.7 | Capuchin Corridor, coastal Ecuador | |
| Dry Forest & Semi-Deciduous Weighted Avg. | |||
| C. Salas-Macias, E. Zamora-Ledezma | 70.3 | Capuchin Corridor, coastal Ecuador | |
| Early Successional Forest (10-Year-Old) | |||
| C. Salas-Macias, E. Zamora-Ledezma | 42.9 | Capuchin Corridor, coastal Ecuador | |
| Agricultural – Conventional | |||
| Fallow/Cropland – Smith et al. (2020) | 7 | Brazilian Amazon | |
| Pasture – X. Haro-Carrión et al. | 3.3 | Capuchin Corridor, coastal Ecuador | |
| Avg. Agricultural – Conventional | 5.2 | ||
| Agricultural – Tree-based | |||
| Agroforestry (Eguiguren et al. (2021) | 44 | Mache-Chindul, coastal Ecuador | |
| Teak Plantation (4-18 yr-old) (Eguiguren et al. (2021) | 59 | Mache-Chindul, coastal Ecuador | |
| Balsa Plantation (Eguiguren et al. (2021) | 21 | Central Amazon of Ecuador | |
| Other Regional References | |||
| Selectively Logged Forest ((Eguiguren et al. (2021) | 102 | Mache-Chindul, coastal Ecuador | |
| Dry Semi-Deciduous Forest | 123.1 | Pacoche Reserve, coastal Ecuador | |
|
Secondary forest avg. as percentage of mature forest avg.
|
|||
| X. Haro-Carrión | 58% | Capuchin Corridor, coastal Ecuador | |
| M. Ellis | 57% | Capuchin Corridor, coastal Ecuador | |
| Degraded Dry/Semi-Deciduous Forest | |||
| At 58% of the weighted avg. of Dry/Semi-Deciduous | 40.8 | Capuchin Corridor, coastal Ecuador | |
Notes & Definitions:
- “AGB” means above-ground biomass.
- “Mg” is the abbreviation for megagrams, which is equivalent to one metric ton.
- “Mg C/ha” signifies metric tons of carbon per hectare.
- “Mature forest” is defined as forests with minimal anthropogenic intervention, good structural and floristic composition, and closed canopy.
- “Evergreen” forest, in this context, is defined as a broadleaf forest in which the vast majority of its trees have leaves at any given time of the year.
- The category “Evergreen Forest” includes moist forest and cloud forest.
- The “weighted average” of “Mature Evergreen Forest” is the average of cloud forest (25%) and mature moist forest (75%), in line with their relative occurrence in the Capuchin Corridor.
- “Secondary forest” is defined as forest with a history of significant human intervention, currently has a closed canopy, typically 8-20m canopy height.
- “Tropical dry forest,” also known as “tropical deciduous forest” is a tropical forest in which the majority of tree species loose their leaves for most of the dry season.
- “Semi-deciduous forest” is defined as a forest comprised of a mix of evergreen trees and deciduous trees.
- In this case, “Dry Forest & Semi-Deciduous Forest” includes tropical dry forest (i.e., deciduous forest), secondary semi-deciduous forest, and mature semi-deciduous forest. The “weighted average” is an average of each of those carbon densities weighted by the relative occurrence of each class in the Capuchin Corridor: 10% dry forest, 10% mature semi-deciduous forest, and 80% secondary semi-deciduous forest.
- “Early-successional forest” is defined as a young secondary forest in the early stages of regeneration–typically 2-10 years old.
- “Fallows” is land that is submitted to a slash-and-burn cycle, in which natural vegetation is allowed to grow unabated for 1-7 years (during which time it is “fallow”) and then is slashed and burned for corn, cattle, or other agricultural uses.
Sources:
- Haro-Carrión et al. (2021)
- Ellis (2022)
- Salas-Macias et al. (2017)
- Eguiguren et al. (2021)
- Smith et al. (2020)
- See below for details of Salas-Macias & Zamora-Ledezma (2023)
Salas-Macias & Zamora-Ledezma (2023)
The primary biomass inventory was conducted by Dr. Carlos Salas-Macias and Dr.Ezequiel Zamora-Ledezma with the Universidad Técnica de Manabí in 2022 and 2023. Their findings have not yet been officially published. Below is an explanation of their methods and sources.
Methods
Four sample plots of 20 x 50 m (1000 m2) were used to determine the carbon stored in living aboveground biomass in each of four types of forest: Moist evergreen forest; cloud forest; 10-year-old early successional forest; and dry/semi-deciduous forest. Within each plot, data on total height and diameter at breast height (DBH) of all individuals with DBH greater than or equal to 5 cm were recorded. For the estimation of biomass (kg) the allometric equation proposed by (Chave et al., 2005) was used, which also incorporates information on wood density obtained from the Global wood density database (Zanne et al., 2009). In cases where there was no data on wood density of the species, the genus or family value was used (Honorio & Baker, 2010). To carry out the conversion of aerial biomass to carbon, it was assumed that the carbon content is 50% of the aerial biomass of each living tree (Penman et al., 2003; Hetland et al., 2016; Tashi et al., 2016, Vijayakumar et al., 2016), The data is expressed in Mg ha-1.
Bibliographical references
- Chave, J., Andalo, C., Brown, S., Cairns, M. A., Chambers, J. Q., Eamus, D., Fölster, H., Fromard, F., Higuchi, N., & Kira, T. (2005). Tree allometry and improved estimation of carbon stocks and balance in tropical forests. Oecologia, 145(1), 87–99. https://doi.org/10.1007/s00442-005-0100-x
- Hetland, J., Yowargana, P., Leduc, S., & Kraxner, F. (2016). Carbon-negative emissions: Systemic impacts of biomass conversion: A case study on CO2 capture and storage options. International Journal of Greenhouse Gas Control, 49, 330–342. https://doi.org/10.1016/j.ijggc.2016.03.017
- Honorio, E., N., & Baker, T., R. (2010). Manual para el monitoreo del ciclo del carbono en bosques amazónicos. Instituto de Investigaciones de la Amazonia Peruana. Universidad de Leeds. Lima. Recuperado de http://www.rainfor.org/upload/ManualsSpanish/Honorio_Baker2010%20Manual%20carbono.pdf
- Penman, J., Gytarsky, M., Hiraishi, T., Krug, T., Kruger, D., Pipatti, R., Buendia, L., Miwa, K., Ngara, T., Tanabe, K., Wagner, F. (2003). Good practice guidance for land use, land-use change and forestry. Institute for Global Environmental Strategies. ISBN 4-88788-003-0. Recuperado de https://www.ipcc-nggip.iges.or.jp/public/gpglulucf/gpglulucf_files/GPG_LULUCF_FULL.pdf
- Tashi, S., Singh, B., Keitel, C., & Adams, M. (2016). Soil carbon and nitrogen stocks in forests along an altitudinal gradient in the eastern Himalayas and a meta-analysis of global data. Global Change Biology, 22(6), 2255–2268. https://doi.org/https://doi.org/10.1111/gcb.13234
- Vijayakumar, D., Raulier, F., Bernier, P., Paré, D., Gauthier, S., Bergeron, Y., & Pothier, D. (2016). Cover density recovery after fire disturbance controls landscape aboveground biomass carbon in the boreal forest of eastern Canada. Forest Ecology and Management, 360, 170–180. https://doi.org/10.1016/j.foreco.2015.10.035
- Zanne, A.E., Lopez-Gonzalez, G., Coomes, D.A., Ilic, J., Jansen, S., Lewis, S.L., Miller, R.B., Swenson, G., Wiemann, M.C., Chave, J. (2009), Data from: Towards a worldwide wood economics spectrum, Dryad, Dataset, https://doi.org/10.5061/dryad.234
Total Carbon Stock
Carbon in above-ground biomass (AGB) is the largest carbon pool in forests and it’s the most responsive to deforestation and forest degradation. It’s also the easiest (and therefore most reliable) to measure.
Nevertheless, we also calculated other carbon pools (e.g., soil organic carbon, below-ground biomass, necromass, etc.) by extrapolating their values from above-ground biomass. This process was aided by numerous academic publications on the subject, most notably Eguiguren et al. (2021) “Estimating carbon stocks across forest types in the Ecuadorian lowland forest.”
| Land Cover Class | Total C Stock | C from AGB | C from BGB | Soil C (SOC) | Necromass C |
| Mature Wet Forest (Pata de Pájaro) | 241.6 | 148 | 35.6 | 51.8 | 6.2 |
| Mature Cloud Forest | 166 | 101.6 | 24.5 | 35.5 | 6 |
| Mature Moist Forest | 199.1 | 121.8 | 29.4 | 42.6 | 5.3 |
| Mature Evergreen Forest Weighted Avg. (Moist + Cloud) | 190.8 | 116.8 | 28.2 | 40.8 | 5.4 |
| Secondary Evergreen Forest | 130.3 | 66.3 | 16 | 40.9 | 7.1 |
| Mature Semi-Deciduous Forest | 182.4 | 111.6 | 26.9 | 39 | 4.9 |
| Secondary Semi-Deciduous Forest | 127.2 | 64.7 | 15.6 | 39.9 | 7 |
| Dry Forest | 150.9 | 73.6 | 17.7 | 52 | 7.5 |
| Dry Forest & Semi-Deciduous Forest Weighted Avg. | 135.1 | 70.3 | 16.9 | 41 | 6.8 |
| Degraded Dry Forest & Semi-Deciduous Forest | 80.1 | 40.8 | 9.8 | 25 | 7.4 |
| Agroforestry | 97.6 | 44 | 10.6 | 37 | 6 |
| Agriculture/Fallows | 67.1 | 7 | 1.7 | 57.4 | 1 |
| Pasture | 56.1 | 3.3 | 0.8 | 51 | 1 |
| Agricultural/Fallows/Pasture Avg. | 61.6 | 5.15 | 1.25 | 54.2 | 1 |
Notes & Definitions:
- Measured in metric tons of carbon per hectare (Mg C/ha).
- “AGB” means above-ground biomass.
- “BGB” means below-ground biomass.
- “SOC” means soil organic carbon.
- “Necromass” is the mass of dead timber in a forest, dead bacteria etc.
- For land class definitions and sources, see the “Notes & Definitions” in the “Biomass Inventories” section.
- BGB, Necromass, and SOC values were extrapolated from AGB values in line with the ratios for lowland forest in northwest Ecuador in Eguiguren et al. (2021)
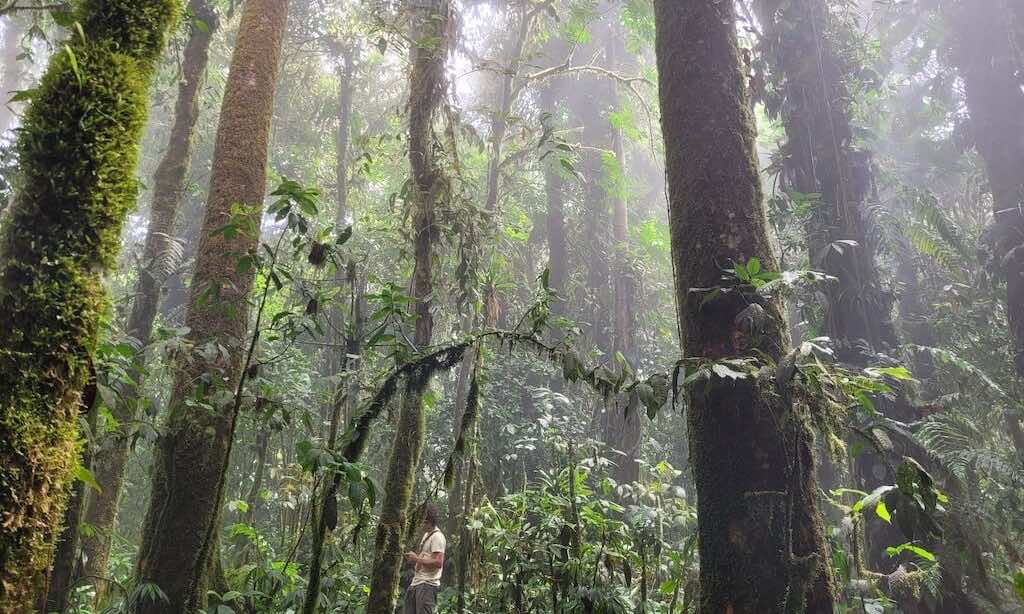
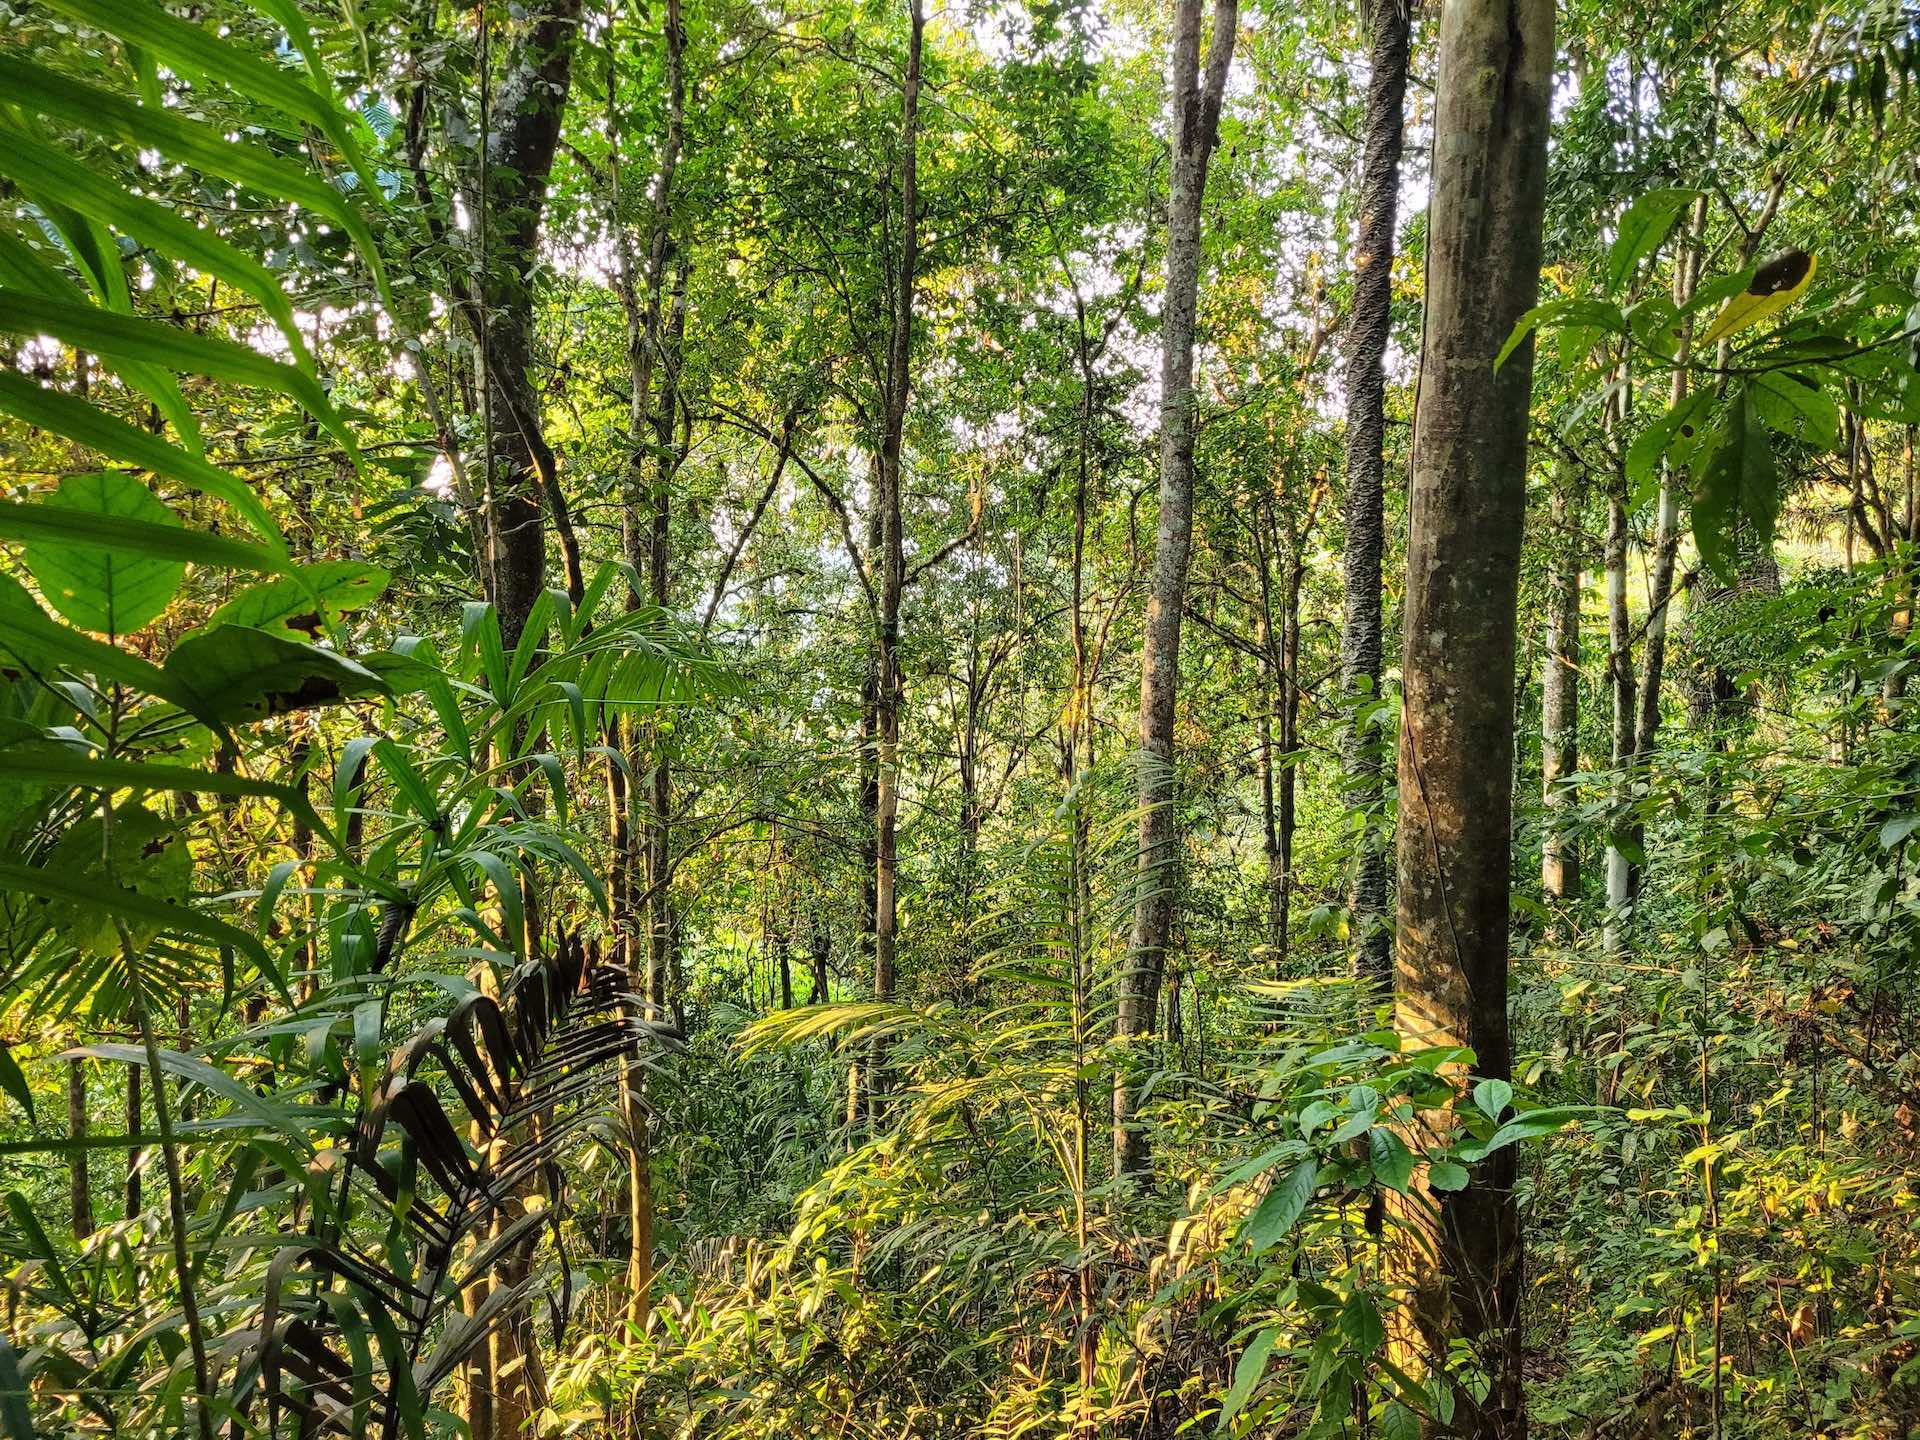
Cloud forest of the Capuchin Corridor