This is a summary of the carbon assessment of the Capuchin Corridor and the Camarones River Basin in coastal Ecuador, using two different methodologies. The first is the conventional methodology known as REDD+, the acronym for Reducing Emissions from Deforestation and Forest Degradation. The second is a new methodology called the Forest Carbon Ledger (FCL).
FCL is a methodology we developed in response to many of the defects we encountered with REDD+ during the measurement and estimation process. For an in-depth comparison of these two methodologies, check out Comparing the Forest Carbon Ledger to REDD+: Using the Capuchin Corridor in Ecuador as a case study. For a deeper understanding of how the FCL works, and why it was created, refer to Flipping REDD+ on Its Head: The Forest Carbon Ledger (FCL) is a new valuation method. The biomass numbers in this assessment are sourced from the Biomass Inventory of the Capuchin Corridor that we conducted in partnership with researchers from the Universidad Técnica de Manabí.
Brief Explanation of the Project Areas
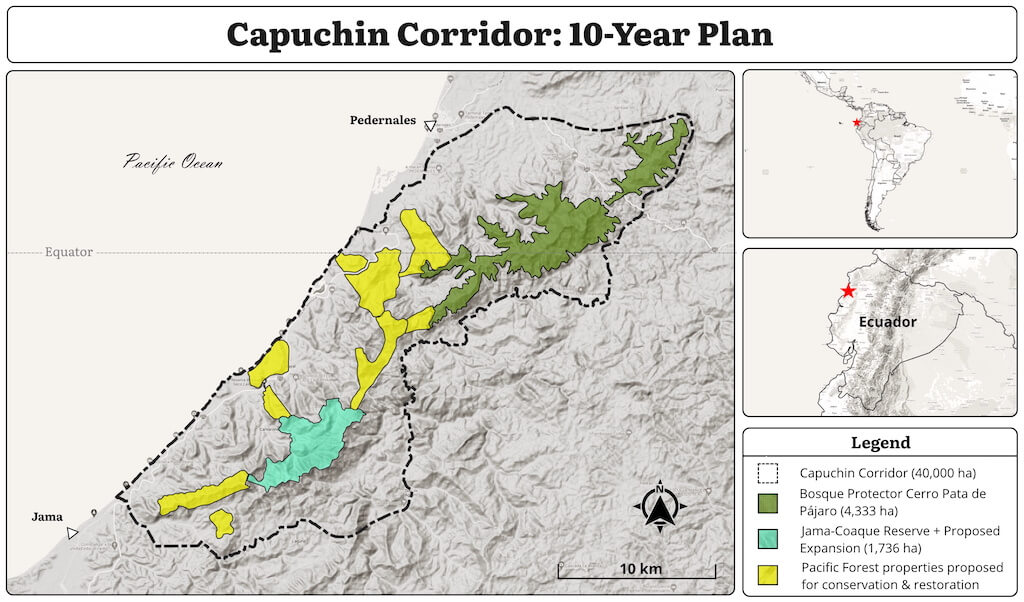
The Capuchin Corridor spans a 43-kilometer mountain range that runs parallel to the Pacific Ocean. This corridor is home to one of the last major remnants of Ecuador’s Pacific Forest—an ecosystem that has already lost 98% of its native forest over the course of the last century.
The Capuchin Corridor contains a wide range of distinct tropical forest types, including cloud forest, moist evergreen forest, tropical dry forest, semi-deciduous forest, and a small remnant of primary-growth wet forest at the top of Cerro Pata de Pájaro. It also contains a patchwork of agricultural land that has been eating away at the forest for the last century.
In its entirety, the Capuchin Corridor is 40,000 hectares. The carbon estimates in this report analyze 37,000 hectares.
The Camarones River Basin occupies 2,980 hectares in the heart of the Capuchin Corridor and is the site of the Jama-Coaque Ecological Reserve—TMA’s flagship project. It’s also the place where TMA pilots its projects before expanding out into the rest of the Capuchin Corridor.
 Brief Explanation of the Numbers
There are three sets of measurements involved in assessing the CO2 benefits of a given forest: land cover, biomass inventory, and the final estimate of net CO2 benefits. Below is a summary of each set of calculations, starting from the conclusion.
Annual CO2 Benefit (Summary)
Annual CO2 benefit of the Capuchin Corridor and the Camarones River Basin are calculated using the following variables:
- Different carbon accounting methodologies: Forest Carbon Ledger (FCL) vs REDD+
- Different carbon pools: all carbon pools (ie., total carbon stock) vs above-ground biomass (AGB)
- Different project scope: entire project area vs only the areas in which direct intervention will take place
Table 1A. Annual CO2 benefit using FCL vs REDD+
| Methodology | Capuchin Corridor | Camarones Watershed | ||
| Total Carbon Stock | AGB Carbon | Total Carbon Stock | AGB Carbon | |
| Forest Carbon Ledger (FCL) | ||||
| Annual CO2 benefit (tons) | 199,768 | 110,260 | 20,718 | 11,655 |
| Annual value at $25/ton | $4,994,200 | $2,756,500 | $517,950 | $291,375 |
| REDD+ | ||||
| Annual CO2 benefit (tons) | 188,207 | 140,485 | 14,261 | 10,654 |
| Annual value at $25/ton | $4,705,175 | $3,512,125 | $356,525 | $266,350 |
Notes:
- Measured in metric tons of CO2 per year (Mg CO2 yr-1)
- Total carbon stock includes carbon from above-ground biomass, below-ground biomass, necromass, and soil organic carbon.
- “AGB” refers to carbon from above-ground biomass only.
- Land cover assessment provided by The Landscapes & Livelihoods Group (TLLG)
- Takes into account the entire project areas.
- All monetary values are in USD$
Table 1B. Annual CO2 benefit according to project scope
| Project Scope | Capuchin Corridor | Camarones Watershed | ||
| Total Carbon Stock | AGB Carbon | Total Carbon Stock | AGB Carbon | |
| Entire Project Area | ||||
| Annual CO2 benefit (tons) | 199,768 | 110,260 | 20,718 | 11,655 |
| Annual value at $25/ton | $4,994,200 | $2,756,500 | $517,950 | $291,375 |
| Direct Intervention Area | ||||
| Annual CO2 benefit (tons) | 78,256 | 44,471 | 16,701 | 9,424 |
| Annual value at $25/ton | $1,956,405 | $1,111,785 | $417,519 | $235,608 |
Notes:
- Measured in metric tons of CO2 per year (Mg CO2 yr-1)
- Land cover assessment by The Landscapes & Livelihoods Group (TLLG)
- Uses FCL for carbon accounting
Table 1C. Annual CO2 benefit per hectare
| Methodology | Capuchin Corridor | Camarones Watershed | ||
| Total Carbon Stock | AGB Carbon | Total Carbon Stock | AGB Carbon | |
| Forest Carbon Ledger (FCL) | ||||
| Annual CO2 per ha. of forest (tons) | 9.4 | 5.2 | 9.7 | 5.5 |
| Annual value per ha of forest @ $25/ton | $235 | $130 | $243 | $137 |
| REDD+ | ||||
| Annual CO2 per ha. of forest (tons) | 8.9 | 6.6 | 6.7 | 5.0 |
| Annual value per ha of forest @ $25/ton | $222 | $166 | $168 | $125 |
Notes:
- Land cover assessment by The Landscapes & Livelihoods Group (TLLG)
- Takes into account the entire project areas
Forest Carbon Ledger (FCL)
The FCL is an annual ledger that tracks the carbon stock of a forest year-over-year. Below are the FCL estimates that measure carbon from above-ground biomass at the present point in time. As stated above, a detailed account of FCL calculations in the Capuchin Corridor can be found in the case study. For a comprehensive explanation of how FCL works, and why it is more reliable than REDD+, refer to Flipping REDD+ on Its Head: The Forest Carbon Ledger (FCL) is a new valuation method.
Table 2A. FCL estimate of the Capuchin Corridor (above-ground carbon, year 0)
| Land Class | Area (ha) | Mg C/ha) | Mg C) | Mg CO2) | Mg CO2 @ 1/50 |
| Mature Evergreen Forest | 6,172 | 116.8 | 720,797 | 2,645,325 | 52,907 |
| Secondary Evergreen Forest | 10,146 | 66.3 | 672,680 | 2,468,735 | 49,375 |
| Mature Wet Forest (Pata de Pájaro) | 380 | 148.0 | 56,240 | 206,401 | 4,128 |
| Dry Forest & Semi-Deciduous Forest | 4,516 | 70.3 | 317,552 | 1,165,417 | 23,308 |
| Total Forest Area | 21,214 | 83.3 | 1,767,269 | 6,485,878 | 129,718 |
| 15% risk buffer & leakage discount | 19,458 | ||||
| FCL annual CO2 storage (tons) | 110,260 | ||||
| FCL annual value @ $25/ton | $2,756,498 |
Table 2B. FCL estimate of the Camarones River Basin (above-ground carbon, year 0)
| Land Class | Area (ha) | Mg C/ha) | Mg C) | Mg CO2) | Mg CO2 @ 1/50 |
| Mature Evergreen Forest | 878 | 116.8 | 102,572 | 376,440 | 7,529 |
| Secondary Evergreen Forest | 897 | 66.3 | 59,484 | 218,308 | 4,366 |
| Mature Wet Forest (Pata de Pájaro) | 0 | 148.0 | 0 | 0 | 0 |
| Dry Forest & Semi-Deciduous Forest | 352 | 70.3 | 24,745 | 90,813 | 1,816 |
| Total Forest Area | 2,127 | 156.1 | 186,801 | 685,561 | 13,711 |
| 15% risk buffer & leakage discount | 2,057 | ||||
| FCL annual CO2 storage (tons) | 11,655 | ||||
| FCL annual value @ $25/ton | $291,363 |
Notes to tables 2A and 2B:
- Assumes a risk buffer & leakage discount of 15%.
The summaries for FCL calculations of Total Carbon Stock and the Direct Intervention Area can be found in Table 1B. For the complete calculations, refer to our database Carbon Stock of the Capuchin Corridor.
REDD+ Estimate
The following REDD+ carbon estimation was performed by The Landscapes & Livelihoods Group (TLLG), a carbon project developer and monitoring specialist accredited by Plan Vivo, a carbon offset standard with a strong emphasis on empowering rural communities.
REDD+ is a methodology for valuing the CO2 benefit of a forest. It does this by estimating how much CO2 would be released into the atmosphere from the cutting and/or burning of trees in a hypothetical “business-as-usual” scenario. It then compares this number to the amount of CO2 that would presumably be released into the atmosphere in a “project scenario,” in which actions are taken to prevent the cutting and/or burning. The difference between these two numbers = net carbon benefit.
The measurements below take into account the entire project areas and assume a risk buffer & leakage discount of 15% and an effectiveness rate of 75%.
Table 3A. Annual CO2 benefit (REDD+)
| REDD+ Estimation | Capuchin Corridor | Camarones Watershed | ||
| Total Carbon Stock | AGB Carbon | Total Carbon Stock | AGB Carbon | |
| Baseline scenario emissions from deforestation and forest degradation expected during the project period | 295,227 | 220,369 | 22,370 | 16,711 |
| Expected project scenario emissions from deforestation and forest degradation expected during the project period | 73,807 | 55,092 | 5,593 | 4,178 |
| Non-permanence risk buffer & leakage emissions expected to result from displacement of deforestation and degradation during the project period | 33,213 | 24,792 | 2,517 | 1,880 |
| Climate benefits expected to result from reduced deforestation and forest degradation as result of project activities during the project period | 188,207 | 140,485 | 14,261 | 10,654 |
| Annual Co2 value @ $25/ton | $4,705,179 | $3,512,131 | $356,523 | $266,338 |
The baseline numbers in the table above are informed by projections of annual deforestation and degradation rates in the future—in this case, over a five-year period of the future. These deforestation rates are extrapolated from historic deforestation rates in the same area as well as adjacent areas that are judged to be comparable in terms of topography, demographics, road access, economic pressures, political conditions, etc. It’s a subjective estimate.
Table 3B. Deforestation/Forest Degradation Projections
| Baseline Projections | Forest Class | Capuchin Corridor |
Camarones River Basin
|
|
Hectares of deforestation avoided per year (projected)
|
Mature Evergreen | 104 | 7.7 |
| Secondary Evergreen | 202 | 14.9 | |
| Mature Wet Forest | 0 | 0 | |
| Dry & Semi-Deciduous Forest | 136 | 10.9 | |
| Total hectares | 442 | 33.5 | |
| Annual deforestation rate | 2.08% | 1.57% | |
|
Hectares of degradation avoided per year (projected)
|
Mature Evergreen | 47 | 4 |
| Secondary Evergreen | 0 | 0 | |
| Mature Wet Forest | 0 | 0 | |
| Dry & Semi-Deciduous Forest | 37 | 2.8 | |
| Total hectares | 84 | 6.8 | |
| Annual degradation rate | 0.40% | 0.32% |
Land Cover Assessment
A land cover assessment is the first step toward quantifying the carbon value of a forest. This requires breaking the forest down into its various different land classes, which (ideally) can each be distinguished by aerial imagery paired with machine learning algorithms. We contracted two different specialists to perform land cover assessments of both areas.
The first analyst, Sake Alkema, worked at IUCN-Netherlands at the time; now he’s a remote sensing specialist for the global nature tech company Satelligence. The second remote sensing specialist was the Plan Vivo-accredited carbon project developer The Landscapes and Livelihoods Group (TLLG).
To assist in this process, we helped train the latter’s algorithm by recording ground data at 211 different points throughout the project area. Below are the results from both land cover assessments.
Table 4A. Land cover assessment by Sake Alkema / IUCN-NL (2018)
| Capuchin Corridor | Camarones River Basin | |||
| Land Class | Area (ha) | % of total land | Area (ha) | % of total land |
| Evergreen Forest | 15,622 | 42% | 1,985 | 67% |
| —Secondary Moist Forest | 10,935 | 30% | 1,143 | 38% |
| —Mature Moist Forest | 3,515 | 9% | 548 | 18% |
| —Cloud Forest | 1,172 | 3% | 295 | 10% |
| Dry Forest & Semi-Deciduous Forest | 8,989 | 24% | 540 | 18% |
| —Dry Forest | 989 | 3% | 49 | 2% |
| —Secondary Semi-Deciduous Forest | 7,192 | 19% | 432 | 15% |
| —Mature Semi-Deciduous Forest | 809 | 2% | 59 | 2% |
| Agriculture | 11,380 | 31% | 342 | 11% |
| Other (Residential/Water) | 1,032 | 3% | 113 | 4% |
| Total Land Area | 37,024 | 2,981 | ||
| Total Forest Area | 24,611 | 66% | 2,525 | 85% |
Table 4B. Land cover assessment by TLLG (2022)
| Capuchin Corridor | Camarones River Basin | |||
| Land Class | Area (ha) | % of total land | Area (ha) | % of total land |
| Mature Evergreen Forest | 6,172 | 17% | 878 | 29% |
| Secondary Evergreen Forest | 10,146 | 27% | 897 | 30% |
| Mature Wet Forest (Pata de Pájaro) | 380 | 1% | 0 | 0% |
| Dry Forest & Semi-Deciduous Forest | 4,516 | 12% | 352 | 12% |
| Agriculture | 14,037 | 38% | 741 | 25% |
| Other (Residential/Water) | 1,769 | 5% | 113 | 4% |
| Total Land Area | 37,020 | 2,981 | ||
| Total Forest Area | 21,214 | 57% | 2,127 | 71% |
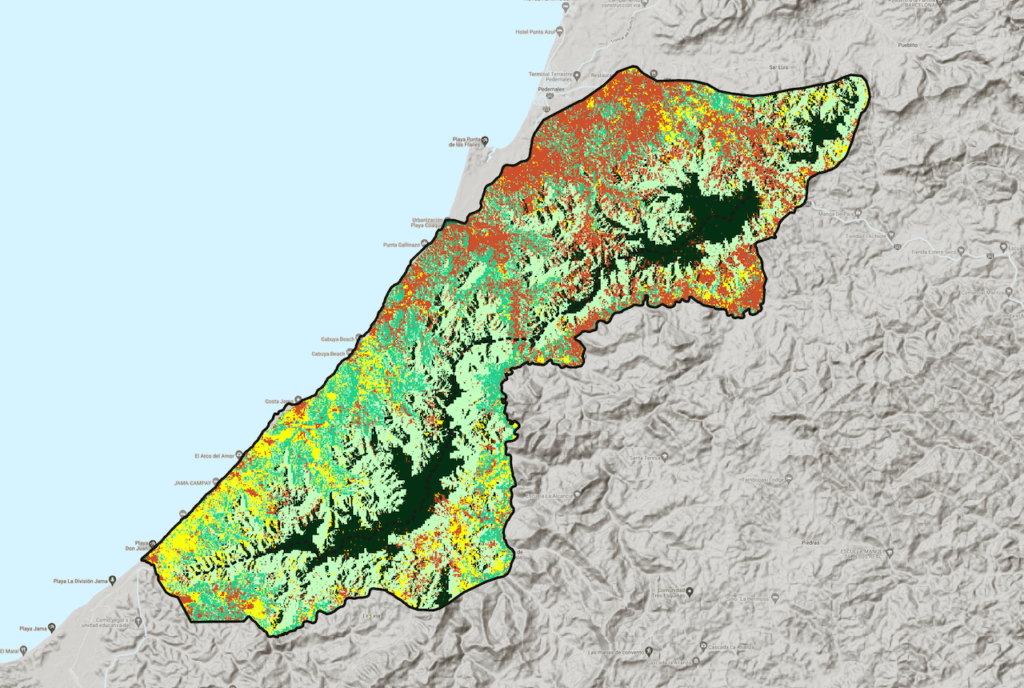
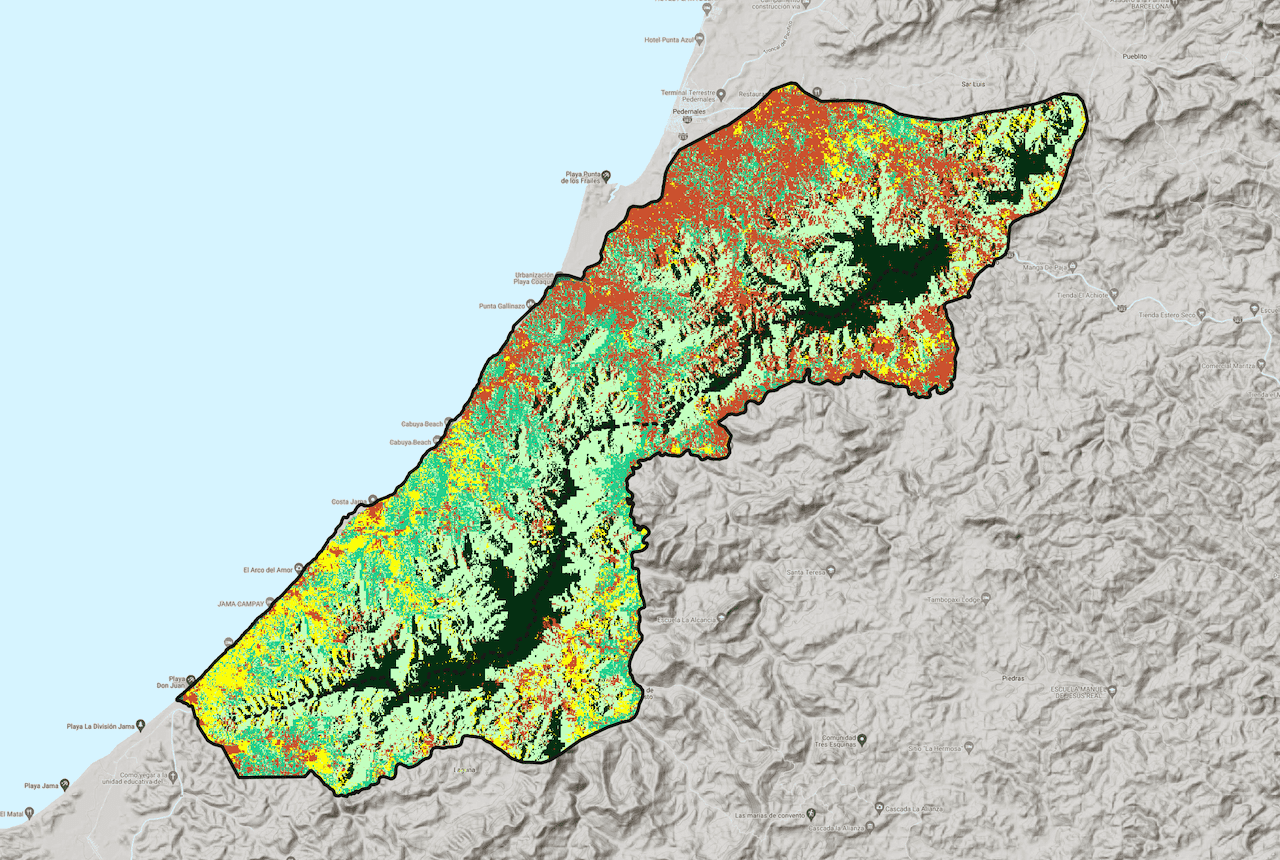
Land cover map of the Capuchin Corridor prepared by The Landscapes & Livelihoods Group (TLLG).
Biomass Inventories & Carbon Density
To estimate the initial carbon stock of the forest, we conducted several biomass inventories in the Capuchin Corridor, most notably in partnership with the Universidad Técnica de Manabí. Then we compared their results to each other and to other biomass inventories in nearby areas or comparable regions. The results were consistent across all biomass inventories. From these results, we took the averages for each forest class.
Below is a summary of the carbon densities of each major land class. To explore the results in greater detail, including biomass results for each sub-class, refer to Biomass Inventory of the Capuchin Corridor.
Table 5. Average carbon density per hectare
| Major Land Cover Class | Total Carbon Stock | AGB Carbon |
| Mature Evergreen Forest | 190.8 | 116.8 |
| Secondary Evergreen Forest | 130.3 | 66.3 |
| Mature Wet Forest (Pata de Pájaro) | 241.6 | 148 |
| Dry Forest & Semi-Deciduous Forest | 135.1 | 70.3 |
| Degraded Dry/Semi-Deciduous Forest | 80.1 | 40.8 |
Notes:
- Measured in metric tons of carbon per hectare (Mg C/ha)
- Total carbon stock includes carbon from above-ground biomass, below-ground biomass, necromass, and soil organic carbon.
- “AGB” refers to carbon from above-ground biomass only.
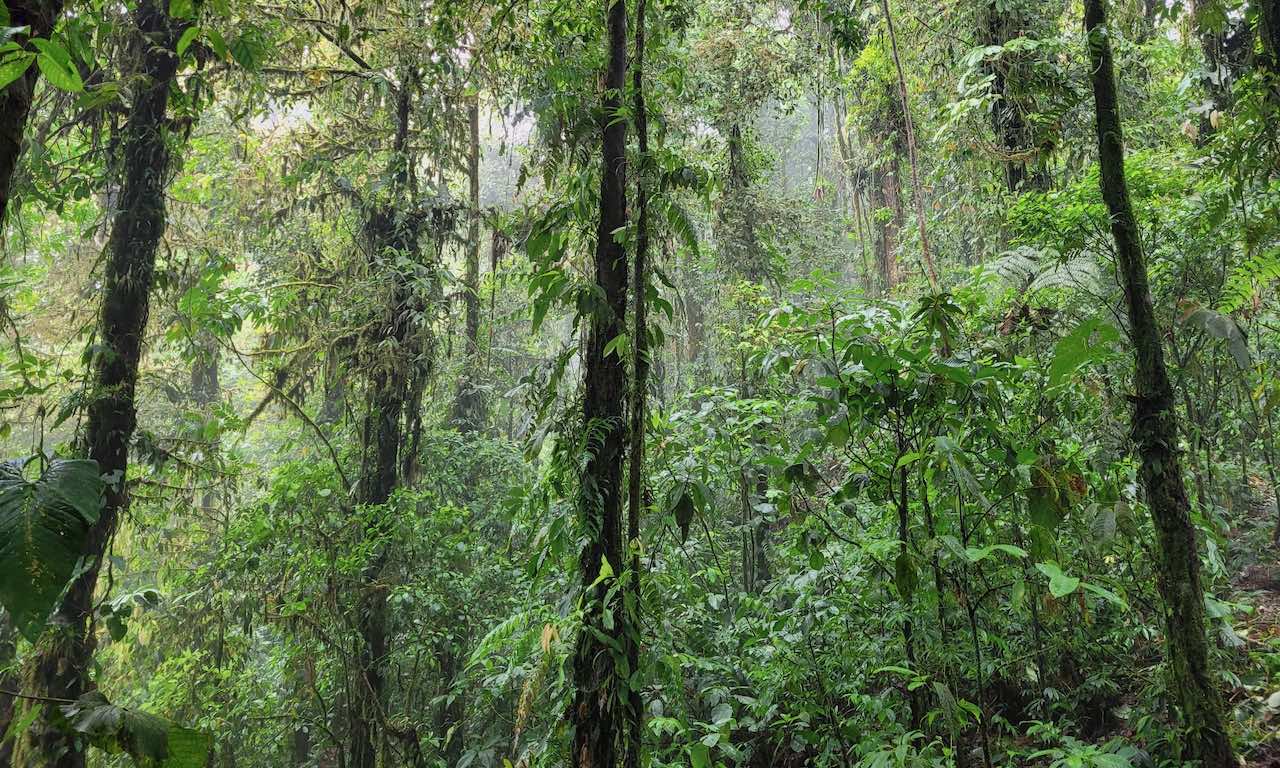
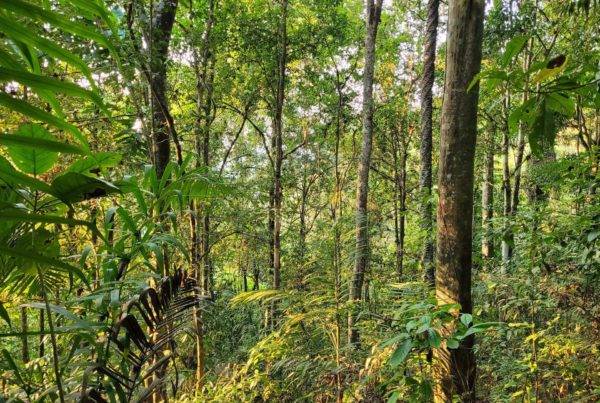
Mature wet forest of Cerro Pata de Pájaro.
Conclusion
For reasons amply explained in the case study and FCL white paper, we believe that FCL is preferable to REDD+ as a methodology for estimating the CO2 benefit of the Capuchin Corridor and Camarones River Basin.
To be conservative, we’ve chosen to limit our carbon inventory to above-ground biomass (AGB), rather than use total carbon stock. AGB is the most straightforward carbon pool to measure and it is, by far, the most responsive to forest loss/gain. The numbers below refer to the entire project areas.
|
CO2 Valuation (FCL)
|
Above-ground carbon (AGB) | |
| Capuchin Corridor | Camarones River Basin | |
| Annual CO2 benefit | 110,260 tons | 11,655 tons |
| Annual CO2 per hectare of forest | 5.2 tons | 5.5 ton |
| Annual CO2 value at $25/ton | $2,756,500 | $291,375 |